
Air Properties — Density, Viscosity, Heat Capacity, Thermal Conductivity
Density, viscosity, heat capacity, thermal conductivity and more properties of air.
Overview
Dry air is a mixture of roughly 78 % nitrogen, 21 % oxygen, and 1 % argon by volume. Its thermophysical properties vary with temperature and pressure and are essential inputs for HVAC design, combustion calculations, pneumatic systems, and atmospheric science. This page summarizes key property values at standard conditions, provides compact reference tables, and illustrates common engineering calculations.
Standard-Condition Properties
Property | Value (SI) | Value (IP) |
|---|---|---|
| Molar mass | 28.97 g/mol | 28.97 g/mol |
| Density at 0 °C, 1 bar | 1.276 kg/m³ | 0.0797 lb/ft³ |
| Density at 20 °C, 1 atm | 1.205 kg/m³ | 0.0752 lb/ft³ |
| Specific heat, Cp (0 °C, 1 bar) | 1.006 kJ/(kg·K) | 0.2403 Btu/(lb·°F) |
| Specific heat, Cv (0 °C, 1 bar) | 0.717 kJ/(kg·K) | 0.1713 Btu/(lb·°F) |
| Specific heat ratio, k = Cp/Cv | 1.400 | 1.400 |
| Thermal conductivity (0 °C, 1 bar) | 24.35 mW/(m·K) | 0.0141 Btu/(h·ft·°F) |
| Dynamic viscosity (0 °C, 1 bar) | 17.22 μPa·s | — |
| Thermal expansion coeff. (0 °C, 1 bar) | 0.00369 1/K | 0.00205 1/°F |
| Enthalpy (0 °C, 1 bar) | 399.4 kJ/kg | 171.7 Btu/lb |
| Entropy (0 °C, 1 bar) | 3.796 kJ/(kg·K) | 0.907 Btu/(lb·°F) |
| Bulk modulus elasticity | 1.01325×10^5 Pa (101.325 kPa) | 14.7 psi |
Source: engineeringtoolbox.com
Bulk Modulus Elasticity
The source air-property reference lists Bulk Modulus Elasticity for air. At standard atmospheric pressure this is approximately 1.01325×10^5 Pa (101.325 kPa), equivalent to 14.7 psi.
Phase-Change and Critical-Point Data
Property | Temperature (K) | Temperature (°C) | Pressure |
|---|---|---|---|
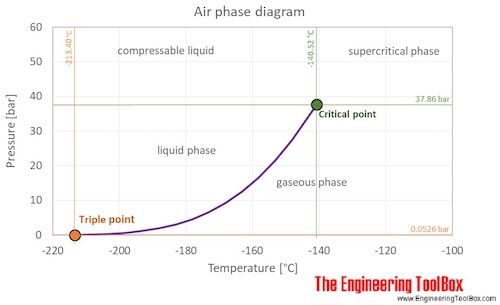
| Triple point | 59.75 | -213.4 | 5.265 kPa |
| Boiling point (1 bar) | 78.8 | -194.4 | 1 bar |
| Condensation point (1 bar) | 81.8 | -191.4 | 1 bar |
| Critical point | 132.63 | -140.52 | 3.786 MPa |
Source: engineeringtoolbox.com
Critical density at the critical point is 302.6 kg/m³.
Interactive Air Phase Diagram Points
The original air phase diagram is preserved below. Its labeled reference points are also represented here as structured data so the phase-change information is not available only inside the bitmap.
Air Phase-Change and Critical Points
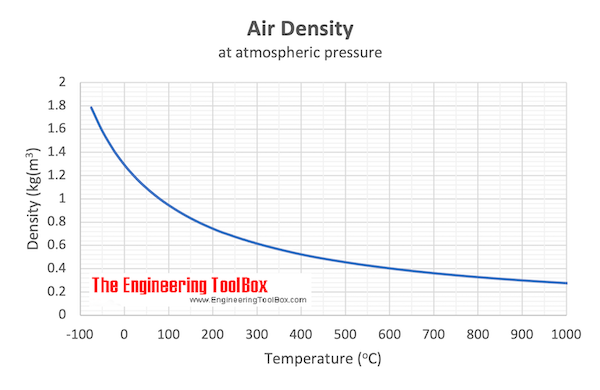
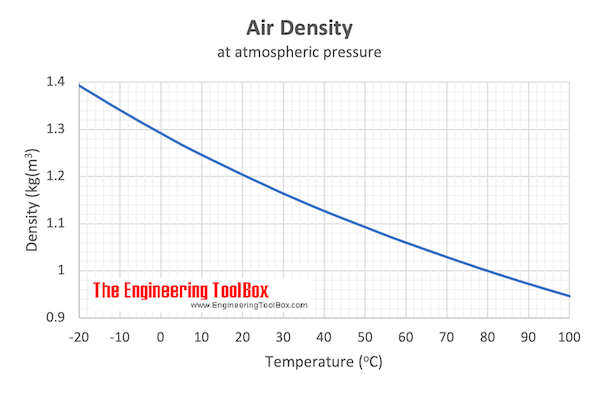
Density vs Temperature
Air Density vs Temperature at 1 atm
Density decreases roughly linearly with temperature over moderate ranges, but the true relationship follows the ideal-gas law ().
Calculator — Air Density (Ideal Gas)
Air Density Calculator
Calculator — Mass of Air
Mass of Air from Volume and Density
Calculator — Dynamic and Kinematic Viscosity
Source table values are interpolated for dry air at atmospheric pressure.
Air Viscosity Calculator
Calculator — Thermal Conductivity
Air Thermal Conductivity Calculator
Calculator — Specific Heat and Sensible Heat
Air Sensible Heat Calculator
Calculator — Buoyant Lifting Force
Hot-Air Lifting Force
Restored Original Source Tables
The following tables are restored from the original source page to preserve the complete reference data.
Source Calculator Signals
The cached source page contains one form and 58 input elements, but these signals come from shared Engineering ToolBox page controls and search/layout widgets rather than 59 independent air-property calculators. The migrated functional equivalents for the substantive engineering calculations are the density, air mass, dynamic and kinematic viscosity, thermal conductivity, sensible heat, and hot-air lifting force calculators above.
Original Source Images
The following original source images are preserved to avoid losing visual reference material. When an image contains chart or tabular data, its extracted values are represented in the page tables, calculators, or interactive charts; remaining images are retained as visual source references.
Engineering Notes
- Moisture matters. Values above are for dry air. Humid air is less dense at the same temperature and pressure because water vapor () is lighter than the N₂/O₂ mixture it displaces. Use humidity-corrected density for accurate HVAC and psychrometric calculations.
- Pressure dependence. At moderate pressures (roughly 0.5–2 bar) air behaves nearly ideally. At high pressures (e.g., compressed-air systems above 10 bar), apply compressibility corrections.
- Standard reference states. Data are commonly reported at 0 °C / 1 bar or at 15 °C / 1 atm (ISA standard). Always confirm the reference state when comparing values across sources.
- Critical point. Above 132.63 K and 3.786 MPa, air cannot be liquefied by pressure alone; this is relevant to cryogenic air-separation plant design.
- Viscosity trend. Unlike liquids, gas viscosity increases with temperature due to greater molecular momentum transfer. Dynamic viscosity rises from approximately 17 μPa·s at 0 °C to approximately 23 μPa·s at 100 °C.
- Specific heat ratio. The ratio for dry air at ambient conditions is widely used in isentropic-flow and compression calculations.
Key Formulas
Ideal-gas density
where is absolute pressure (Pa), is the specific gas constant for dry air (), and is absolute temperature (K).
Mass from density
Buoyant (lifting) force
Sensible heat transfer
Variables
| Symbol | Meaning | Typical SI Unit |
|---|---|---|
| Density | kg/m³ | |
| Absolute pressure | Pa | |
| Specific gas constant, dry air = 287.058 | J/(kg·K) | |
| Absolute temperature | K | |
| Volume | m³ | |
| Mass | kg | |
| Gravitational acceleration = 9.81 | m/s² | |
| Specific heat at constant pressure | kJ/(kg·K) | |
| Specific heat at constant volume | kJ/(kg·K) | |
| Lifting force | N | |
| Heat energy | kJ |
References
- Engineering ToolBox — Air Properties
- CRC Handbook of Chemistry and Physics, standard thermophysical tables
- ISO 2533:1975 — Standard Atmosphere