
Fans Efficiency Power Consumption
Reference data and engineering information about fans efficiency power consumption for dynamics applications.
Overview
Fan power consumption is a primary driver of HVAC system energy cost. The ideal shaft power is the product of total pressure rise and volumetric flow rate, but real systems must also account for fan efficiency, drive losses, and installation effects. This page covers the core calculation methods and typical efficiency data for fan selection and energy estimation.
Key Formulas
Ideal (Theoretical) Power
The minimum power required to move air through a pressure rise, with no losses:
Fan Shaft Power
Accounting for fan efficiency :
System Power (Including Drive Losses)
Full system input power including belt drive and motor efficiencies:
Imperial Units
For flow in cfm and pressure in inches of water gauge:
Installation (System) Loss
Additional pressure drop caused by poor inlet/outlet conditions:
Temperature Rise
Nearly all energy lost in the fan heats the airstream:
where is in K and is in Pa.
Variables
Symbol | Description | Unit |
|---|---|---|
| P | Power | W |
| Δp | Total pressure increase across fan | Pa |
| q | Volumetric air flow rate | m³/s |
| μf | Fan efficiency (static or total) | — |
| μb | Belt drive efficiency | — |
| μm | Motor efficiency | — |
| pd | Dynamic pressure at nominal inlet/outlet | Pa |
| xsy | Installation loss coefficient | — |
| Δt | Air temperature rise due to fan losses | K |
Source: engineeringtoolbox.com
Ideal Power Consumption Reference
The table below shows ideal (loss-free) power for a range of common operating points. Real shaft power will be higher by the inverse of fan efficiency.
Flow Rate(m³/s) | Δp = 250 Pa(W) | Δp = 500 Pa(W) | Δp = 1000 Pa(W) | Δp = 1500 Pa(W) |
|---|---|---|---|---|
| 0.5 | 125 | 250 | 500 | 750 |
| 1 | 250 | 500 | 1000 | 1500 |
| 1.5 | 375 | 750 | 1500 | 2250 |
| 2 | 500 | 1000 | 2000 | 3000 |
| 2.5 | 625 | 1250 | 2500 | 3750 |
| 3 | 750 | 1500 | 3000 | 4500 |
| 4 | 1000 | 2000 | 4000 | 6000 |
| 5 | 1250 | 2500 | 5000 | 7500 |
Source: engineeringtoolbox.com
Ideal Power vs Flow Rate at Various Pressure Rises
Typical Component Efficiencies
Fan system efficiency depends on the combined losses of the fan itself, the belt drive, and the motor. Values below are representative for equipment in the 1–100 kW range.
Component | Typical Size | Efficiency (η) |
|---|---|---|
| Motor | 1 kW | 0.4 |
| Motor | 5 kW | 0.8 |
| Motor | 10 kW | 0.87 |
| Motor | 50 kW | 0.91 |
| Motor | 100 kW | 0.92 |
| Belt drive | 1 kW | 0.78 |
| Belt drive | 10 kW | 0.88 |
| Belt drive | 100 kW | 0.93 |
| Fan | — | 0.50 – 0.90 |
Source: engineeringtoolbox.com
Calculator — Fan System Power
Fan System Power Consumption
Unit Converter
Fan Airflow, Pressure, and Power Unit Converter
Restored Original Source Tables
The following tables are restored from the original source page to preserve the complete reference data.
Original Source Images
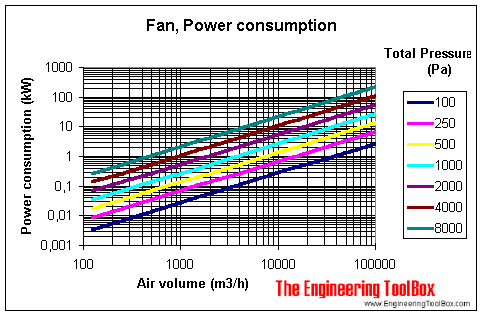
Engineering Notes
- Always use manufacturer data. Published curves and certified ratings account for losses specific to each fan model. The formulas above give useful estimates but cannot replace test-bench data.
- Fan efficiency varies with operating point. Peak efficiency typically occurs near the fan's design duty point. Operating far left or right of this point on the fan curve significantly reduces .
- Static vs. total efficiency. Be consistent with the pressure basis. Static efficiency uses static pressure rise; total efficiency uses total pressure. Mixing the two leads to errors.
- Direct-drive fans eliminate belt losses (), improving system efficiency especially at smaller sizes.
- Installation effects matter. A poorly designed inlet or discharge can add 10–20% to the required pressure, captured by the installation loss coefficient .
- Temperature rise is real. In recirculating or high-pressure systems the relationship can lead to meaningful air heating and must be checked.
Standards
- ISO 12759 — Fans – Efficiency classification for fans
- AMCA 205 — Energy Efficiency Classification for fans