
Power Factor Electrical Motor
Reference data and engineering information about power factor electrical motor for electrical applications.
Overview
The power factor (PF) of an AC motor is the ratio of real power (watts) to apparent power (volt-amperes). A low power factor means the electrical supply must deliver more current than necessary to produce the same useful work, increasing losses in cables, transformers, and switchgear. Motors are the dominant source of low power factor in industrial plants because they draw magnetizing (reactive) current to sustain their magnetic fields.
Power factor is expressed as cos φ, where φ is the phase angle between voltage and current waveforms. A purely resistive load has PF = 1.0; typical induction motors range from 0.15 at no load to 0.85–0.91 at full load depending on size.
Leading and Lagging Power Factors
Induction motors normally operate with a lagging power factor because their magnetizing current lags the applied voltage. Capacitor banks or over-excited synchronous motors can supply reactive power locally and may create a leading power factor if the correction is larger than the load requires. Both leading and lagging conditions have the same numerical power-factor definition, but the sign of reactive power and the direction of VAR flow differ.
Key Formulas
Single-Phase Power Factor
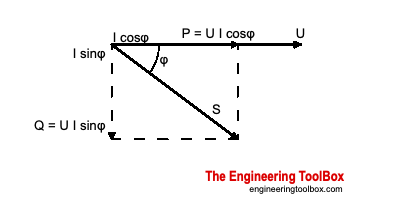
Active, Reactive, and Apparent Power
where S is apparent power (VA), P is active power (W), and Q is reactive power (VAR).
Three-Phase Motor Power
Current Multiplier for Low Power Factor
A circuit with reduced power factor must carry proportionally more current:
For example, at PF = 0.7 the current is 1/0.7 ≈ 1.43 times the current at unity power factor.
Variables
| Symbol | Description | Unit |
|---|---|---|
| PF | Power factor | dimensionless |
| P | Active (real) power | W |
| S | Apparent power | VA |
| Q | Reactive power | VAR |
| V | Voltage | V |
| V_L | Line-to-line voltage | V |
| I_L | Line current | A |
| φ | Phase angle between V and I | degrees |
Typical Motor Power Factors
Power factor varies strongly with load and motor rating. Values below are for standard 1800 rpm NEMA motors:
Motor Power(hp) | No Load | 25 % Load | 50 % Load | 75 % Load | Full Load |
|---|---|---|---|---|---|
| 0–5 | 0.15–0.20 | 0.50–0.60 | 0.72 | 0.82 | 0.84 |
| 5–20 | 0.15–0.20 | 0.50–0.60 | 0.74 | 0.84 | 0.86 |
| 20–100 | 0.15–0.20 | 0.50–0.60 | 0.79 | 0.86 | 0.89 |
| 100–300 | 0.15–0.20 | 0.50–0.60 | 0.81 | 0.88 | 0.91 |
Source: engineeringtoolbox.com
Wire Cross-Section Multiplier
When power factor drops, conductors must be oversized to carry the additional current. The table below gives the required cross-section multiplier relative to a unity-power-factor design:
Power Factor | Cross-Section Multiplier |
|---|---|
| 1 | 1 |
| 0.9 | 1.23 |
| 0.8 | 1.56 |
| 0.7 | 2.04 |
| 0.6 | 2.78 |
| 0.5 | 4 |
| 0.4 | 6.25 |
Source: engineeringtoolbox.com
Industry Typical Power Factors
Industry | PF Low | PF High |
|---|---|---|
| Office | 0.8 | 0.9 |
| Hospital | 0.75 | 0.8 |
| Brewery | 0.75 | 0.8 |
| Cement | 0.75 | 0.8 |
| Foundry | 0.75 | 0.8 |
| Plastic production | 0.75 | 0.8 |
| Forging | 0.7 | 0.8 |
| Steel works | 0.65 | 0.8 |
| Mine (coal) | 0.65 | 0.8 |
| Chemical | 0.65 | 0.75 |
| Metalworking | 0.65 | 0.7 |
| Manufacturing (machines) | 0.6 | 0.65 |
| Stamping | 0.6 | 0.7 |
| Oil pumping | 0.4 | 0.6 |
| Textiles | 0.35 | 0.6 |
Source: engineeringtoolbox.com
Power Factor vs. Motor Load
The chart below shows how power factor improves as motor load increases. Partial loading is the primary cause of poor power factor in motor fleets.
Power Factor vs. Motor Load
Calculator
Use this calculator to find apparent power and reactive power from measured active power and power factor.
Motor Apparent and Reactive Power
Interactive Power Factor Correction Chart
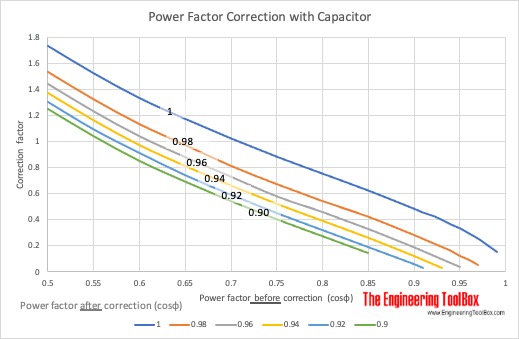
The original capacitor correction chart is represented below as selectable data. The factor is multiplied by active power in kW to estimate required capacitor size in kVAR.
Capacitor Correction Factor by Initial and Target Power Factor
Power Factor Correction Capacitor Size
Restored Original Source Tables
The following tables are restored from the original source page to preserve the complete reference data.
Electrical Motors - Typical Power Factors
Power (hp) | Speed (rpm) | Power Factor (cos φ ) | Power Factor (cos φ ) | Power Factor (cos φ ) | Power Factor (cos φ ) | Power Factor (cos φ ) |
|---|---|---|---|---|---|---|
| Unloaded | 1/4 load | 1/2 load | 3/4 load | full load | ||
| 0 - 5 | 1800 | 0.15 - 0.20 | 0.5 - 0.6 | 0.72 | 0.82 | 0.84 |
| 5 - 20 | 1800 | 0.15 - 0.20 | 0.5 - 0.6 | 0.74 | 0.84 | 0.86 |
| 20 - 100 | 1800 | 0.15 - 0.20 | 0.5 - 0.6 | 0.79 | 0.86 | 0.89 |
| 100 - 300 | 1800 | 0.15 - 0.20 | 0.5 - 0.6 | 0.81 | 0.88 | 0.91 |
Source: engineeringtoolbox.com
Electrical Motors - Power Factors by Industry
Industry | Power Factor |
|---|---|
| Brewery | 75 - 80 |
| Cement | 75 - 80 |
| Chemical | 65 - 75 |
| Electro-chemical | 65 - 75 |
| Foundry | 75 - 80 |
| Forging | 70 - 80 |
| Hospital | 75 - 80 |
| Manufacturing, machines | 60 - 65 |
| Manufacturing, paint | 65 - 70 |
| Metalworking | 65 - 70 |
| Mine, coal | 65 - 80 |
| Office | 80 - 90 |
| Oil pumping | 40 - 60 |
| Plastic production | 75 - 80 |
| Stamping | 60 - 70 |
| Steel works | 65 - 80 |
| Textiles | 35 - 60 |
Source: engineeringtoolbox.com
Electrical Motors - Power Factor Correction with Capacitor
Power factor after improvement (cosΦ) | Power factor after improvement (cosΦ) | Power factor after improvement (cosΦ) | Power factor after improvement (cosΦ) | Power factor after improvement (cosΦ) | Power factor after improvement (cosΦ) | Power factor after improvement (cosΦ) | Power factor after improvement (cosΦ) | Power factor after improvement (cosΦ) | Power factor after improvement (cosΦ) | Power factor after improvement (cosΦ) | Capacitor correction factor |
|---|---|---|---|---|---|---|---|---|---|---|---|
| 1 | 0.99 | 0.98 | 0.97 | 0.96 | 0.95 | 0.94 | 0.93 | 0.92 | 0.91 | 0.9 | |
| 0.5 | 1.73 | 1.59 | 1.53 | 1.48 | 1.44 | 1.4 | 1.37 | 1.34 | 1.3 | 1.28 | 1.25 |
| 0.55 | 1.52 | 1.38 | 1.32 | 1.28 | 1.23 | 1.19 | 1.16 | 1.12 | 1.09 | 1.06 | 1.04 |
| 0.6 | 1.33 | 1.19 | 1.13 | 1.08 | 1.04 | 1.01 | 0.97 | 0.94 | 0.91 | 0.88 | 0.85 |
| 0.65 | 1.17 | 1.03 | 0.97 | 0.92 | 0.88 | 0.84 | 0.81 | 0.77 | 0.74 | 0.71 | 0.69 |
| 0.7 | 1.02 | 0.88 | 0.81 | 0.77 | 0.73 | 0.69 | 0.66 | 0.62 | 0.59 | 0.56 | 0.54 |
| 0.75 | 0.88 | 0.74 | 0.67 | 0.63 | 0.58 | 0.55 | 0.52 | 0.49 | 0.45 | 0.43 | 0.4 |
| 0.8 | 0.75 | 0.61 | 0.54 | 0.5 | 0.46 | 0.42 | 0.39 | 0.35 | 0.32 | 0.29 | 0.27 |
| 0.85 | 0.62 | 0.48 | 0.42 | 0.37 | 0.33 | 0.29 | 0.26 | 0.22 | 0.19 | 0.16 | 0.14 |
| 0.9 | 0.48 | 0.34 | 0.28 | 0.23 | 0.19 | 0.16 | 0.12 | 0.09 | 0.06 | 0.02 | |
| 0.91 | 0.45 | 0.31 | 0.25 | 0.21 | 0.16 | 0.13 | 0.09 | 0.06 | 0.02 | ||
| 0.92 | 0.43 | 0.28 | 0.22 | 0.18 | 0.13 | 0.1 | 0.06 | 0.03 | |||
| 0.93 | 0.4 | 0.25 | 0.19 | 0.15 | 0.1 | 0.07 | 0.03 | ||||
| 0.94 | 0.36 | 0.22 | 0.16 | 0.11 | 0.07 | 0.04 | |||||
| 0.95 | 0.33 | 0.18 | 0.12 | 0.08 | 0.04 | ||||||
| 0.96 | 0.29 | 0.15 | 0.09 | 0.04 | |||||||
| 0.97 | 0.25 | 0.11 | 0.05 | ||||||||
| 0.98 | 0.2 | 0.06 | |||||||||
| 0.99 | 0.14 |
Source: engineeringtoolbox.com
Induction Motors - KVAR Correction Units
Induction Motor Rating (HP) | Nominal Motor Speed (rpm) | Nominal Motor Speed (rpm) | Nominal Motor Speed (rpm) | Nominal Motor Speed (rpm) | Nominal Motor Speed (rpm) | Nominal Motor Speed (rpm) |
|---|---|---|---|---|---|---|
| 3600 | 3600 | 1800 | 1800 | 1200 | 1200 | |
| Capacitor Rating (KVAR) | Reduction of Line Current (%) | Capacitor Rating (KVAR) | Reduction of Line Current (%) | Capacitor Rating (KVAR) | Reduction of Line Current (%) | |
| 3 | 1.5 | 14 | 1.5 | 23 | 2.5 | 28 |
| 5 | 2 | 14 | 2.5 | 22 | 3 | 26 |
| 7.5 | 2.5 | 14 | 3 | 20 | 4 | 21 |
| 10 | 4 | 14 | 4 | 18 | 5 | 21 |
| 15 | 5 | 12 | 5 | 18 | 6 | 20 |
| 20 | 6 | 12 | 6 | 17 | 7.5 | 19 |
| 25 | 7.5 | 12 | 7.5 | 17 | 8 | 19 |
| 30 | 8 | 11 | 8 | 16 | 10 | 19 |
| 40 | 12 | 12 | 13 | 15 | 16 | 19 |
| 50 | 15 | 12 | 18 | 15 | 20 | 19 |
| 60 | 18 | 12 | 21 | 14 | 22.5 | 17 |
| 75 | 20 | 12 | 23 | 14 | 25 | 15 |
| 100 | 22.5 | 11 | 30 | 14 | 30 | 12 |
| 125 | 25 | 10 | 36 | 12 | 35 | 12 |
| 150 | 30 | 10 | 42 | 12 | 40 | 12 |
| 200 | 35 | 10 | 50 | 11 | 50 | 10 |
| 250 | 40 | 11 | 60 | 10 | 62.5 | 10 |
| 300 | 45 | 11 | 68 | 10 | 75 | 12 |
| 350 | 50 | 12 | 75 | 8 | 90 | 12 |
| 400 | 75 | 10 | 80 | 8 | 100 | 12 |
| 450 | 80 | 8 | 90 | 8 | 120 | 10 |
| 500 | 100 | 8 | 120 | 9 | 150 | 12 |
Source: engineeringtoolbox.com
Original Source Images
The following original source images are preserved to avoid losing visual reference material. When an image contains chart or tabular data, its extracted values are represented in the page tables, calculators, or interactive charts; remaining images are retained as visual source references.
Engineering Notes
- Oversizing penalties. A plant at PF = 0.7 needs transformers, cables, and switchgear rated 43 % higher (1/0.7) than the same real load at unity power factor.
- Utility surcharges. Most utilities penalize commercial customers below PF ≈ 0.90–0.95. Correcting power factor can eliminate demand charges and reduce monthly bills.
- Capacitor correction. Power factor correction capacitors supply reactive current locally, reducing the current drawn from the supply. Capacitors should be switched with the motor or grouped at the bus. Over-correction (leading PF) can cause voltage rise and resonance.
- Standards. IEC 61000-3-2 limits harmonic current distortion, which also affects measured power factor. Variable-frequency drives produce harmonic-rich current and may require line reactors or passive filters in addition to power-factor capacitors.
- Motor loading. Running motors well below rated load is the most common cause of poor plant power factor. Matching motor size to the driven load, or using adjustable-speed drives, directly improves PF.
- Synchronous motors. An over-excited synchronous motor can be used to correct power factor and is sometimes preferred in large plants because it provides leading VARs without separate capacitor banks.